> ## Documentation Index
> Fetch the complete documentation index at: https://docs.oasis.camel-ai.org/llms.txt
> Use this file to discover all available pages before exploring further.
# Visualization
# Data Visualization in Oasis
This documentation outlines various visualization techniques and procedures available in the Oasis platform. These visualizations help analyze and interpret simulation results effectively.
## Reddit Score Analysis
The Reddit Score Analysis visualization allows you to compare scores between different treatment groups in your simulations.
### Prerequisites
* Completed simulation using `scripts/reddit_simulation_align_with_human/reddit_simulation_align_with_human.py`
* Generated database file and JSON file from the simulation
### Steps to Generate Visualization
1. **Set up file paths**
After running your simulation, modify the file paths in `visualization/reddit_simulation_align_with_human/code/analysis_all.py`:
```python theme={null}
if __name__ == "__main__":
folder_path = ("visualization/reddit_simulation_align_with_human"
"/experiment_results")
exp_name = "business_3600" # Use your experiment name
db_path = folder_path + f"/{exp_name}.db"
exp_info_file_path = folder_path + f"/{exp_name}.json"
analysis_score.main(exp_info_file_path, db_path, exp_name, folder_path)
```
2. **Install dependencies**
```bash theme={null}
pip install matplotlib
```
3. **Run the analysis script**
```bash theme={null}
python visualization/reddit_simulation_align_with_human/code/analysis_all.py
```
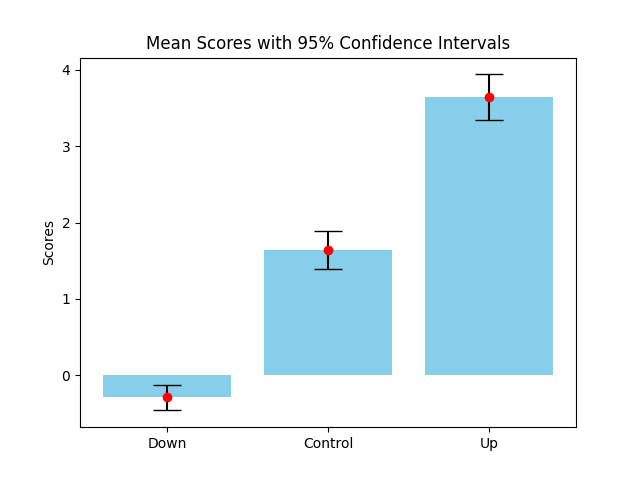
4. **Examine Results**
The script will generate a visualization showing scores for three treatment groups (down-treated, control, up-treated) at the experiment's conclusion.
 ## Reddit Counterfactual Content Analysis
This visualization helps analyze differences in content across various treatment conditions.
### Prerequisites
* OpenAI API key added to environment variables
* Completed simulation using `scripts/reddit_simulation_counterfactual/reddit_simulation_counterfactual.py`
* Generated database files from the simulation
### Steps to Generate Visualization
1. **Configure database paths**
After running your simulation, update the database file paths in `visualization/reddit_simulation_counterfactual/code/analysis_couterfact.py`:
```python theme={null}
db_files = [
'couterfact_up_100.db',
'couterfact_cnotrol_100.db',
'couterfact_down_100.db'
]
```
2. **Install dependencies**
```bash theme={null}
pip install aiohttp
```
3. **Run the analysis script**
```bash theme={null}
python visualization/reddit_simulation_counterfactual/code/analysis_couterfact.py
```
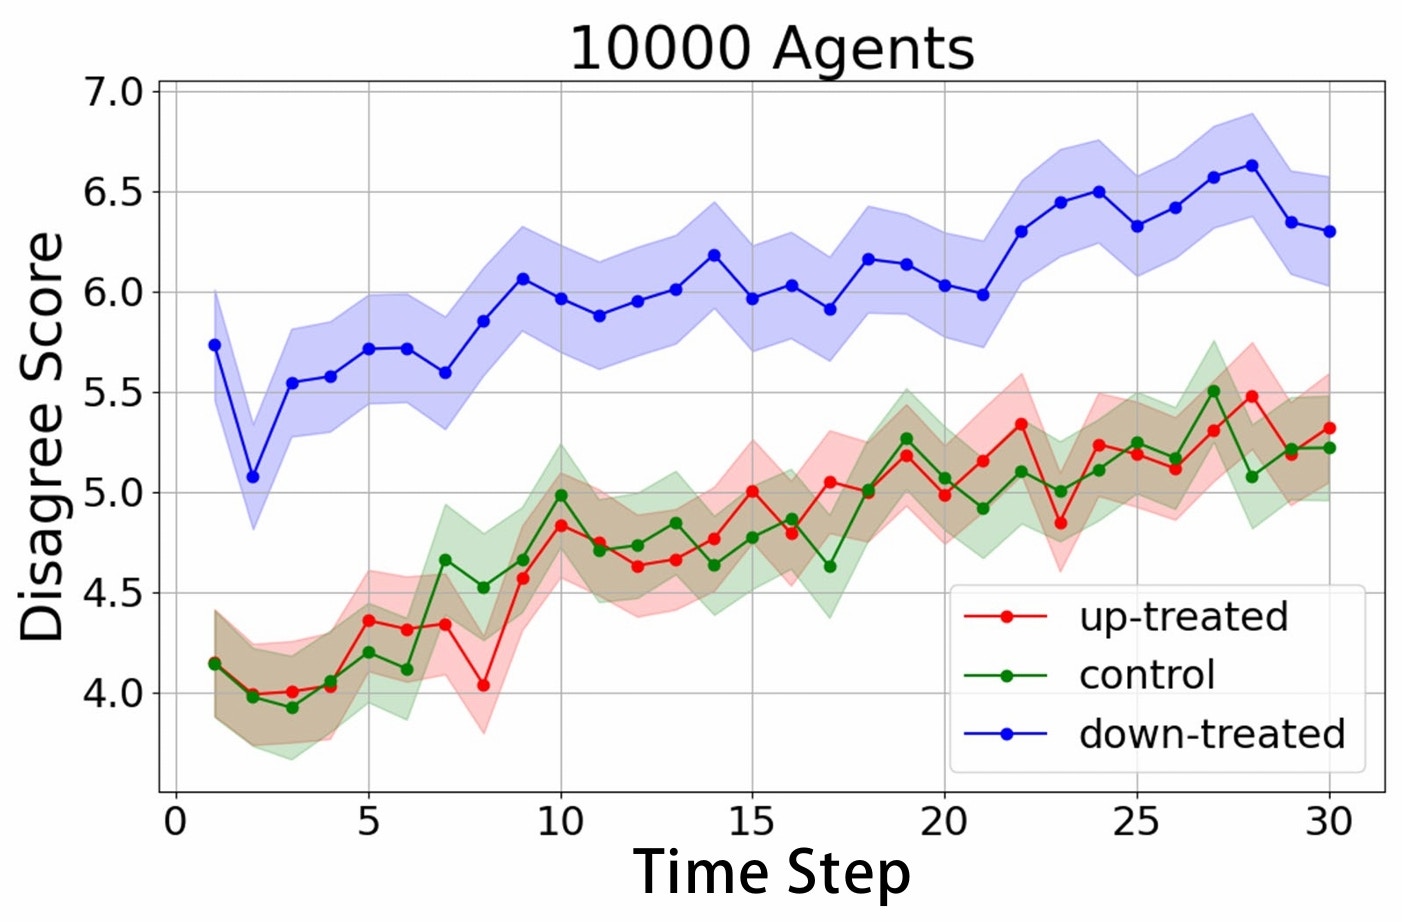
4. **Examine Results**
The script will generate a visualization showing disagree scores for three treatment groups (down-treated, control, up-treated) at each timestep of the experiment.
## Reddit Counterfactual Content Analysis
This visualization helps analyze differences in content across various treatment conditions.
### Prerequisites
* OpenAI API key added to environment variables
* Completed simulation using `scripts/reddit_simulation_counterfactual/reddit_simulation_counterfactual.py`
* Generated database files from the simulation
### Steps to Generate Visualization
1. **Configure database paths**
After running your simulation, update the database file paths in `visualization/reddit_simulation_counterfactual/code/analysis_couterfact.py`:
```python theme={null}
db_files = [
'couterfact_up_100.db',
'couterfact_cnotrol_100.db',
'couterfact_down_100.db'
]
```
2. **Install dependencies**
```bash theme={null}
pip install aiohttp
```
3. **Run the analysis script**
```bash theme={null}
python visualization/reddit_simulation_counterfactual/code/analysis_couterfact.py
```
4. **Examine Results**
The script will generate a visualization showing disagree scores for three treatment groups (down-treated, control, up-treated) at each timestep of the experiment.
 ## Dynamic Follow Network Visualization
This visualization provides an interactive way to explore user follow relationships over time using Neo4j.
### Prerequisites
* Neo4j account and a free instance
* Neo4j credentials (`NEO4J_URI`, `NEO4J_USERNAME`, and `NEO4J_PASSWORD`) saved as environment variables
* Completed simulation generating a database file
### Steps to Create Visualization
1. **Set up Neo4j**
* Register at [https://neo4j.com/](https://neo4j.com/)
* Create a free instance
* Obtain and save credentials as environment variables
* Connect to the instance
2. **Install dependencies**
```bash theme={null}
pip install neo4j
```
3. **Configure database path**
Modify the database path in either:
* `visualization/dynamic_follow_network/code/vis_neo4j_reddit.py` (for Reddit data)
* `visualization/dynamic_follow_network/code/vis_neo4j_twitter.py` (for Twitter data)
```python theme={null}
if __name__ == "__main__":
sqlite_db_path = "all_360_follow.db" # Replace with your SQLite database path
main(sqlite_db_path)
```
4. **Run the appropriate script**
```bash theme={null}
python visualization/dynamic_follow_network/code/vis_neo4j_reddit.py
# or
python visualization/dynamic_follow_network/code/vis_neo4j_twitter.py
```
5. **Explore the visualization**
* Visit [https://console.neo4j.io/](https://console.neo4j.io/) dashboard
* Use the explore page
* In the search bar, select `user-follow-user`
* For the slicer, choose `follow-timestamp` to visualize changes in follow relationships over time
## Additional Visualization Options
Beyond the core visualization techniques described above, the Oasis platform supports customized visualizations based on specific simulation needs. Developers can extend existing visualization modules or create new ones for specialized analysis requirements.
For further assistance with visualization tools or to request additional visualization features, please refer to the project documentation or contact the development team.
## Dynamic Follow Network Visualization
This visualization provides an interactive way to explore user follow relationships over time using Neo4j.
### Prerequisites
* Neo4j account and a free instance
* Neo4j credentials (`NEO4J_URI`, `NEO4J_USERNAME`, and `NEO4J_PASSWORD`) saved as environment variables
* Completed simulation generating a database file
### Steps to Create Visualization
1. **Set up Neo4j**
* Register at [https://neo4j.com/](https://neo4j.com/)
* Create a free instance
* Obtain and save credentials as environment variables
* Connect to the instance
2. **Install dependencies**
```bash theme={null}
pip install neo4j
```
3. **Configure database path**
Modify the database path in either:
* `visualization/dynamic_follow_network/code/vis_neo4j_reddit.py` (for Reddit data)
* `visualization/dynamic_follow_network/code/vis_neo4j_twitter.py` (for Twitter data)
```python theme={null}
if __name__ == "__main__":
sqlite_db_path = "all_360_follow.db" # Replace with your SQLite database path
main(sqlite_db_path)
```
4. **Run the appropriate script**
```bash theme={null}
python visualization/dynamic_follow_network/code/vis_neo4j_reddit.py
# or
python visualization/dynamic_follow_network/code/vis_neo4j_twitter.py
```
5. **Explore the visualization**
* Visit [https://console.neo4j.io/](https://console.neo4j.io/) dashboard
* Use the explore page
* In the search bar, select `user-follow-user`
* For the slicer, choose `follow-timestamp` to visualize changes in follow relationships over time
## Additional Visualization Options
Beyond the core visualization techniques described above, the Oasis platform supports customized visualizations based on specific simulation needs. Developers can extend existing visualization modules or create new ones for specialized analysis requirements.
For further assistance with visualization tools or to request additional visualization features, please refer to the project documentation or contact the development team.